
Bird Biodiversity
What did we monitor?
With the help of our partners at Restoration Environmental Services (thanks, Ry, Mike, and Jenna!), we monitored breeding bird biodiversity in the 28 fields enrolled in our study. Breeding bird populations are commonly monitored by federal, state, and local agencies to determine the viability of bird populations. During the breeding period (around June in the United States), birds are easy to identify and require suitable habitat for breeding. Thus, breeding birds are good indicators that species in lower trophic levels (think - lower on the ‘food chain’) are also in an area like plants for habitat and insects for food.
Why do we care about bird biodiversity?
Farmland bird populations experienced significant declines since the 1960’s. Declines ranged from about a 15% reduction to about a 40% reduction in population size depending on functional grouping between 1960 and 20131. To some farmers, birds may not be a welcomed sign in their fields because they can cause damage to crops and reduce yields and profits. Despite this, birds can play an important and beneficial role in agro-ecosystems.
Birds can provide important ecosystem services in agricultural lands. These services are things like: pest control (birds like to eat insects that could impact crop production), weed control (birds also like to eat seeds - sometimes of weed species), nutrient cycling (the digest things and put those nutrients back into the ground), pollination, and wildlife viewing (birding is a very popular hobby). A single species of bird does not likely provide all the ecosystem service benefits that birds can provide in agricultural lands. Therefore, having a diverse mixture of birds may help ensure more ecosystem services are provided and that they are consistently provided year after year.
All species also have an intrinsic value outside of their value or benefits to human wellbeing. Humans have a disproportionate ability to modify landscapes to fit our needs, and the needs of other species are easily lost in these modified landscapes. Thus, it is important to place ourselves back in the ecosystem instead of outside of it. Every bird has a right to live a full and healthy life - and regenerative organic agricultural landscapes can help provide it.
How does agriculture impact bird biodiversity?
Agricultural landscapes are not ideal habitats for many birds because of lack of suitable habitat and food sources. However, regenerative farms can play an important role in bird conservation. For example, past research has found that bird abundances (e.g., the number of individuals) tend to be higher in organic farms compared to conventional farms2. It is likely that different bird species respond differently to different landscape contexts, but there may be some general correlations between some characteristics and overall species number (e.g., species richness).
Birds can be impacted by many different farming practices. There is a lot of research pointing to the detrimental effects of pesticides on bird populations1. Pesticides can cause direct mortality or have indirect effects on bird physiology. A famous example is DDT, the pesticide that prompted Rachel Carson to write Silent Spring and caused severe population declines of many bird species that were exposed to it. Another driver of bird population declines is habitat loss and fragmentation (Tilman et al 2018). Patchy habitats may make it difficult for some birds to find the resources they need to survive and travel safely. Edge habitat may benefit some species while causing a reduction in others.
There are some practices that have been noted to increase bird populations and biodiversity. For example, studies point to smaller field sizes being beneficial for bird biodiversity 2,3. Smaller field sizes are likely correlated with landscape heterogeneity which has also been found to lead to higher bird biodiversity4. Likewise, agricultural landscapes with higher perennial cover and hedgerows tend to support more bird diversity 2,4. All of these factors likely increase the proportion of suitable habitat, indicate less intensive agriculture, and likely impact the insect populations upon which many bird species depend 5. Biodiversity responses, however, do not necessarily correlate with species-specific responses. Different species or groups of species may need different habitat conditions to survive.
We hypothesize that fields transitioning to regenerative organic agriculture will either see an increase or sustain bird biodiversity through time. Regenerative organic farms have low pesticide and chemical use, can incorporate many types of non-crop area, and may be more heterogeneous than conventional counterparts.
How do we monitor bird biodiversity?
We monitored bird biodiversity during the breeding season - which is in May and June in most of the United States. For each field, two surveys were conducted at least one week apart. Surveys started a half hour before sunrise and lasted through mid-morning. Each bird that was seen or heard was recorded. The monitoring team recorded the species, its behavior, how many they saw, and where it was seen relative to them.
We then summed the number of species and individuals from the two surveys to get the total species richness and abundance of each species per field. From these numbers, we calculated Simpson’s Evenness per field. We also grouped species by habitat guild to report the proportion of individuals and species found in each guild in each field. Lastly, we ran a NMDS (non-metric multidimensional scaling) analysis on both the presence and relative abundance of each species per field. This is a common way to understand how closely related different communities are.
What did we find?
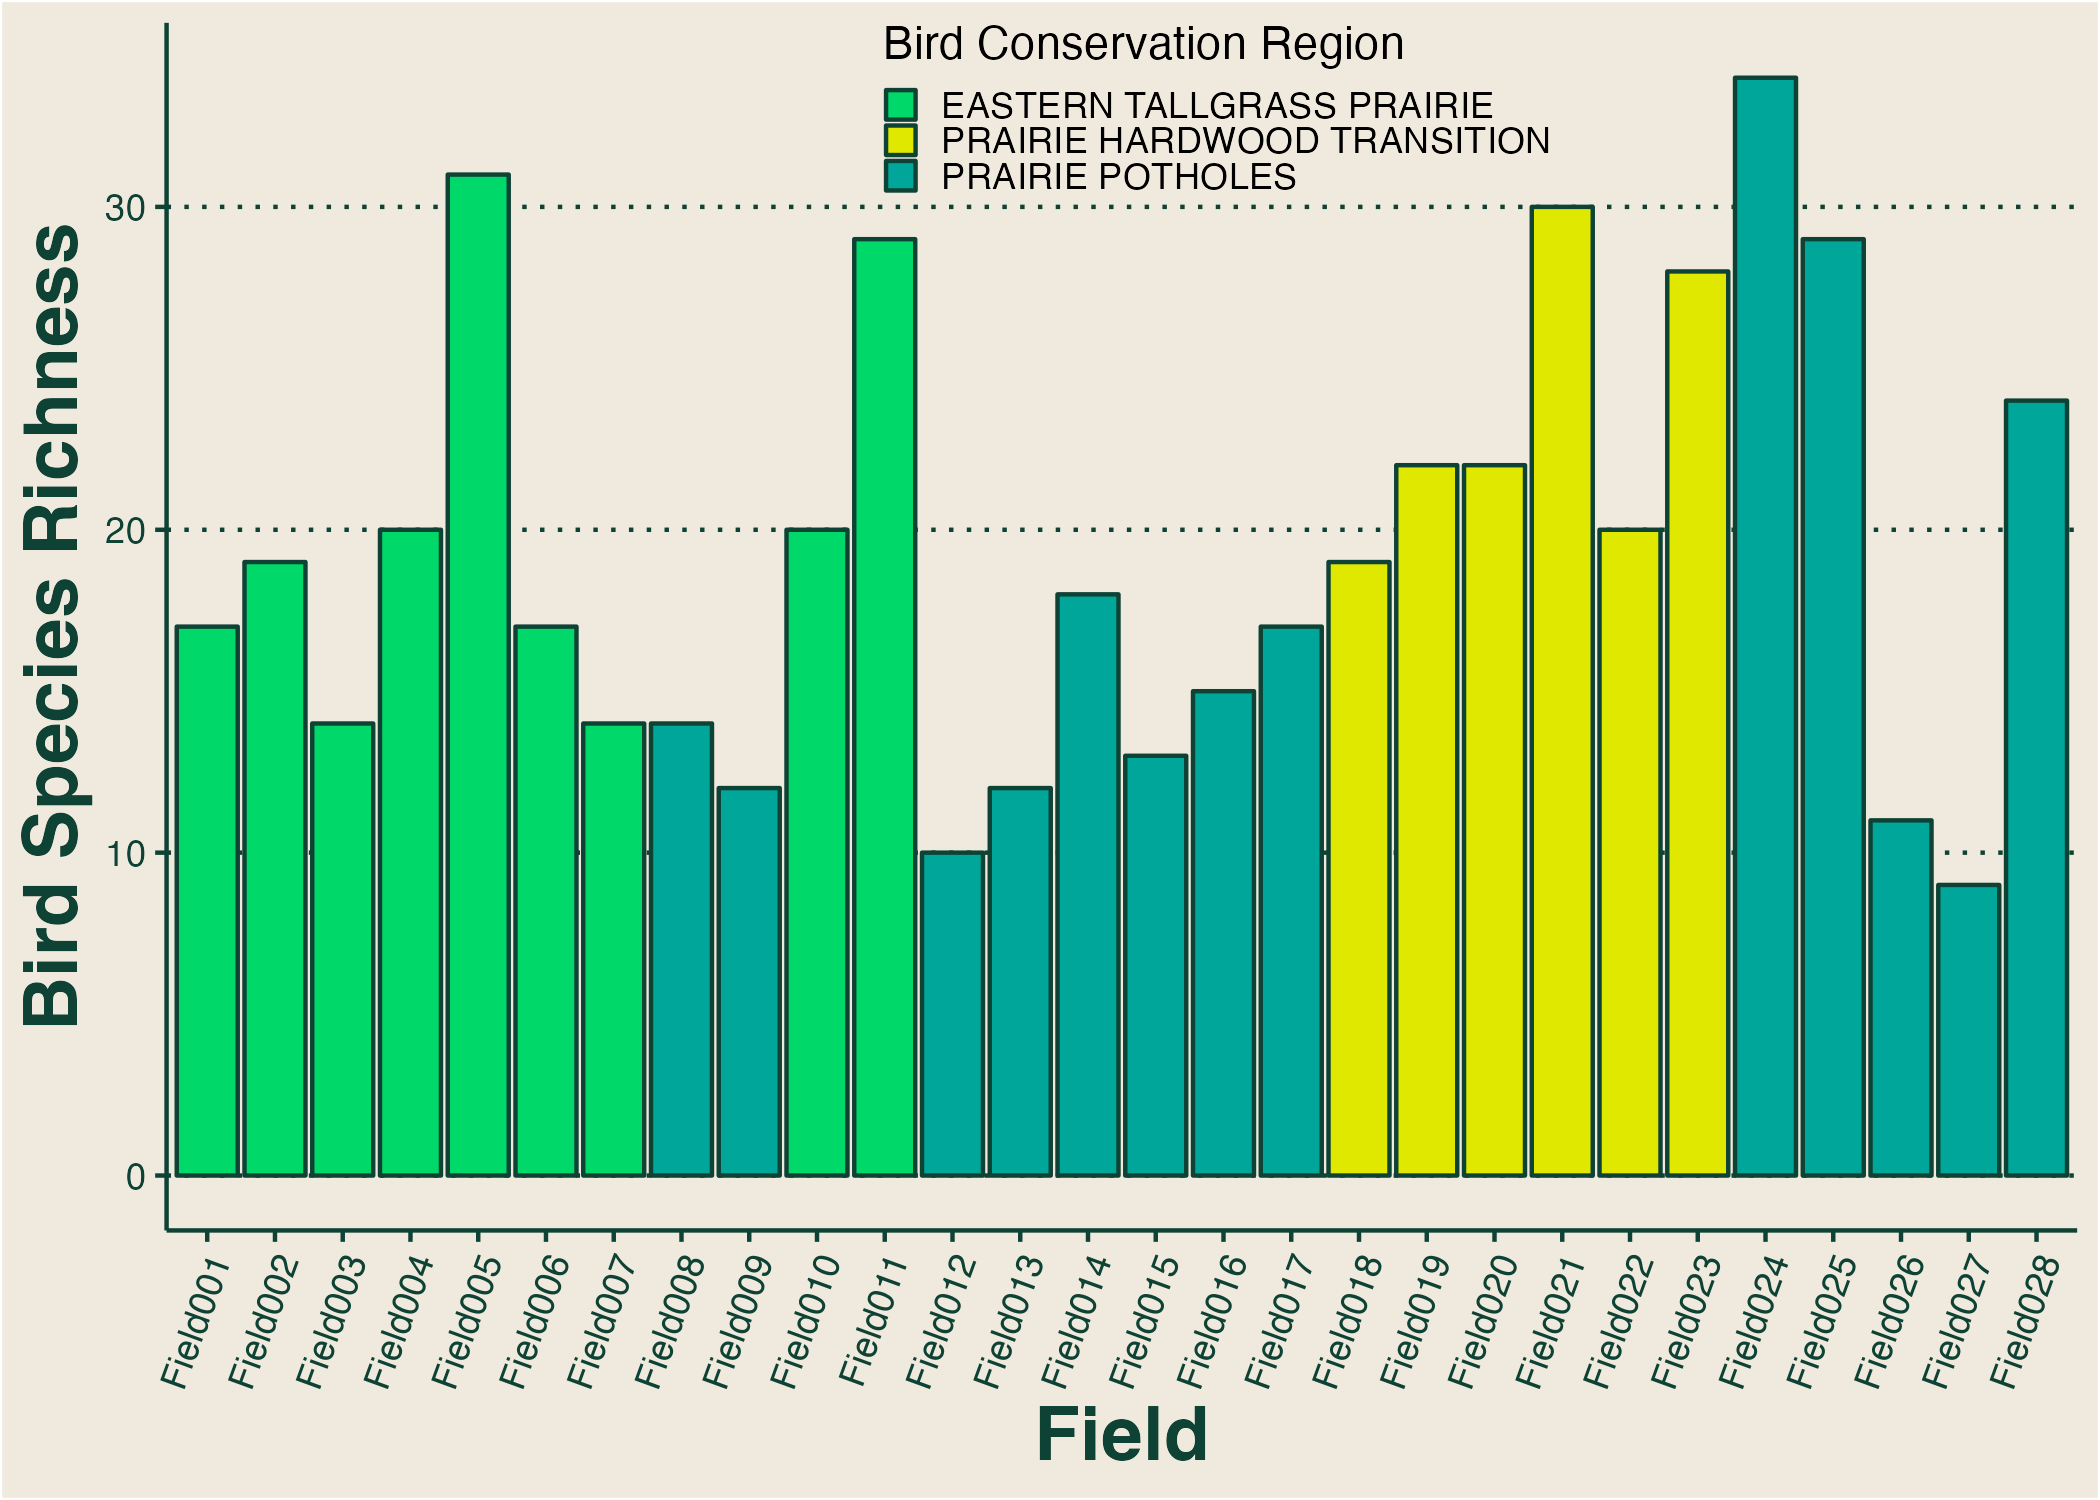
Fig. 1: Bird species richness by field. Each bar represents the baseline species richness observed over two monitoring sessions during the breeding season in either 2021 or 2022. Bars are color-coded by Bird Conservation Regions - regions that have similar bird species compositions and conservation initiatives.
Here, we report the baseline findings from our bird biodiversity monitoring - therefore, we are not analyzing these data for trends, but rather summarizing the current conditions of the 28 fields. Note that fields 002, 018, 021, 022 and 028 have been in their current management scheme for 3+ years and are not ‘transitional’ fields like the other 24.
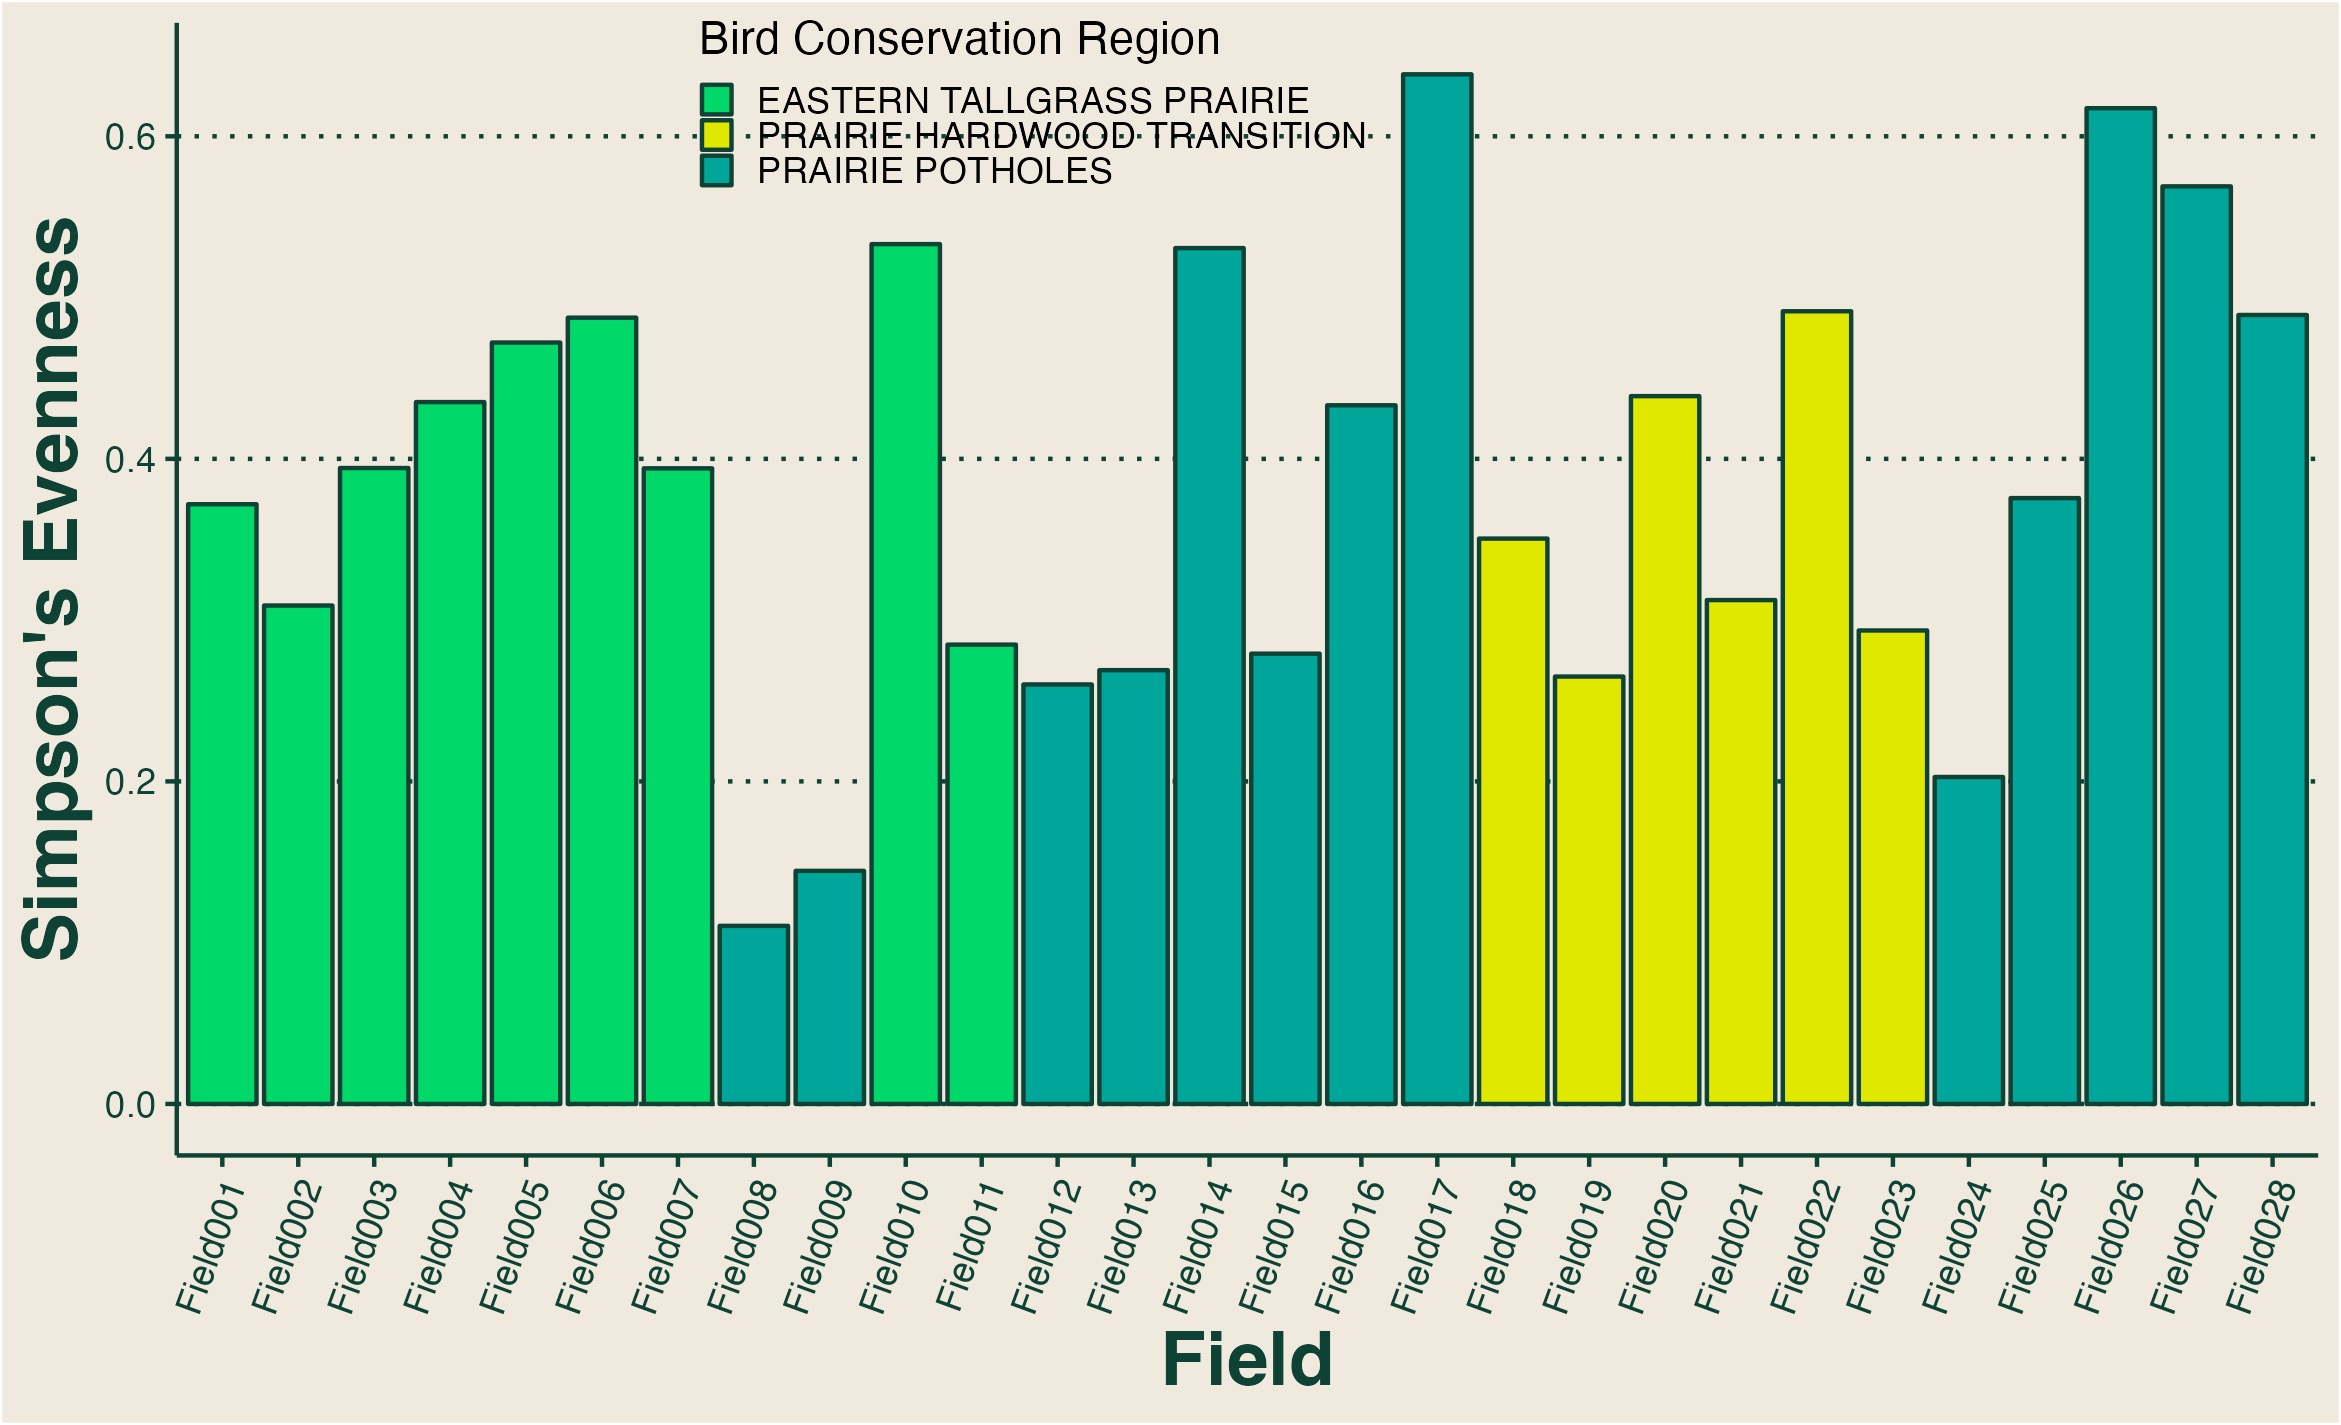
Fig. 2: Simpson’s evenness of bird species by field. Each bar represents the baseline Simpson’s evenness observed over two monitoring sessions during the breeding season in either 2021 or 2022. Note that higher values indicate a more even spread of species abundances whereas lower values indicate dominance by one or few species. Bars are color-coded by Bird Conservation Regions - regions that have similar bird species compositions and conservation initiatives.
Two metrics commonly used to assess biodiversity are species richness (SR)- the total number of different species- and evenness - how equally spread are the number of individuals per species. Here, we use inverse Simpson’s evenness as our measure of evenness. A value closer to 1 indicated a more ‘even’ community.
SR ranged from 9 species to 34 species across all fields with an average SR of about 20 species per field (Fig. 1). Simpson’s evenness ranged from 0.11 to 0.64 across all fields with an average of evenness of 0.38 per field (Fig. 2).
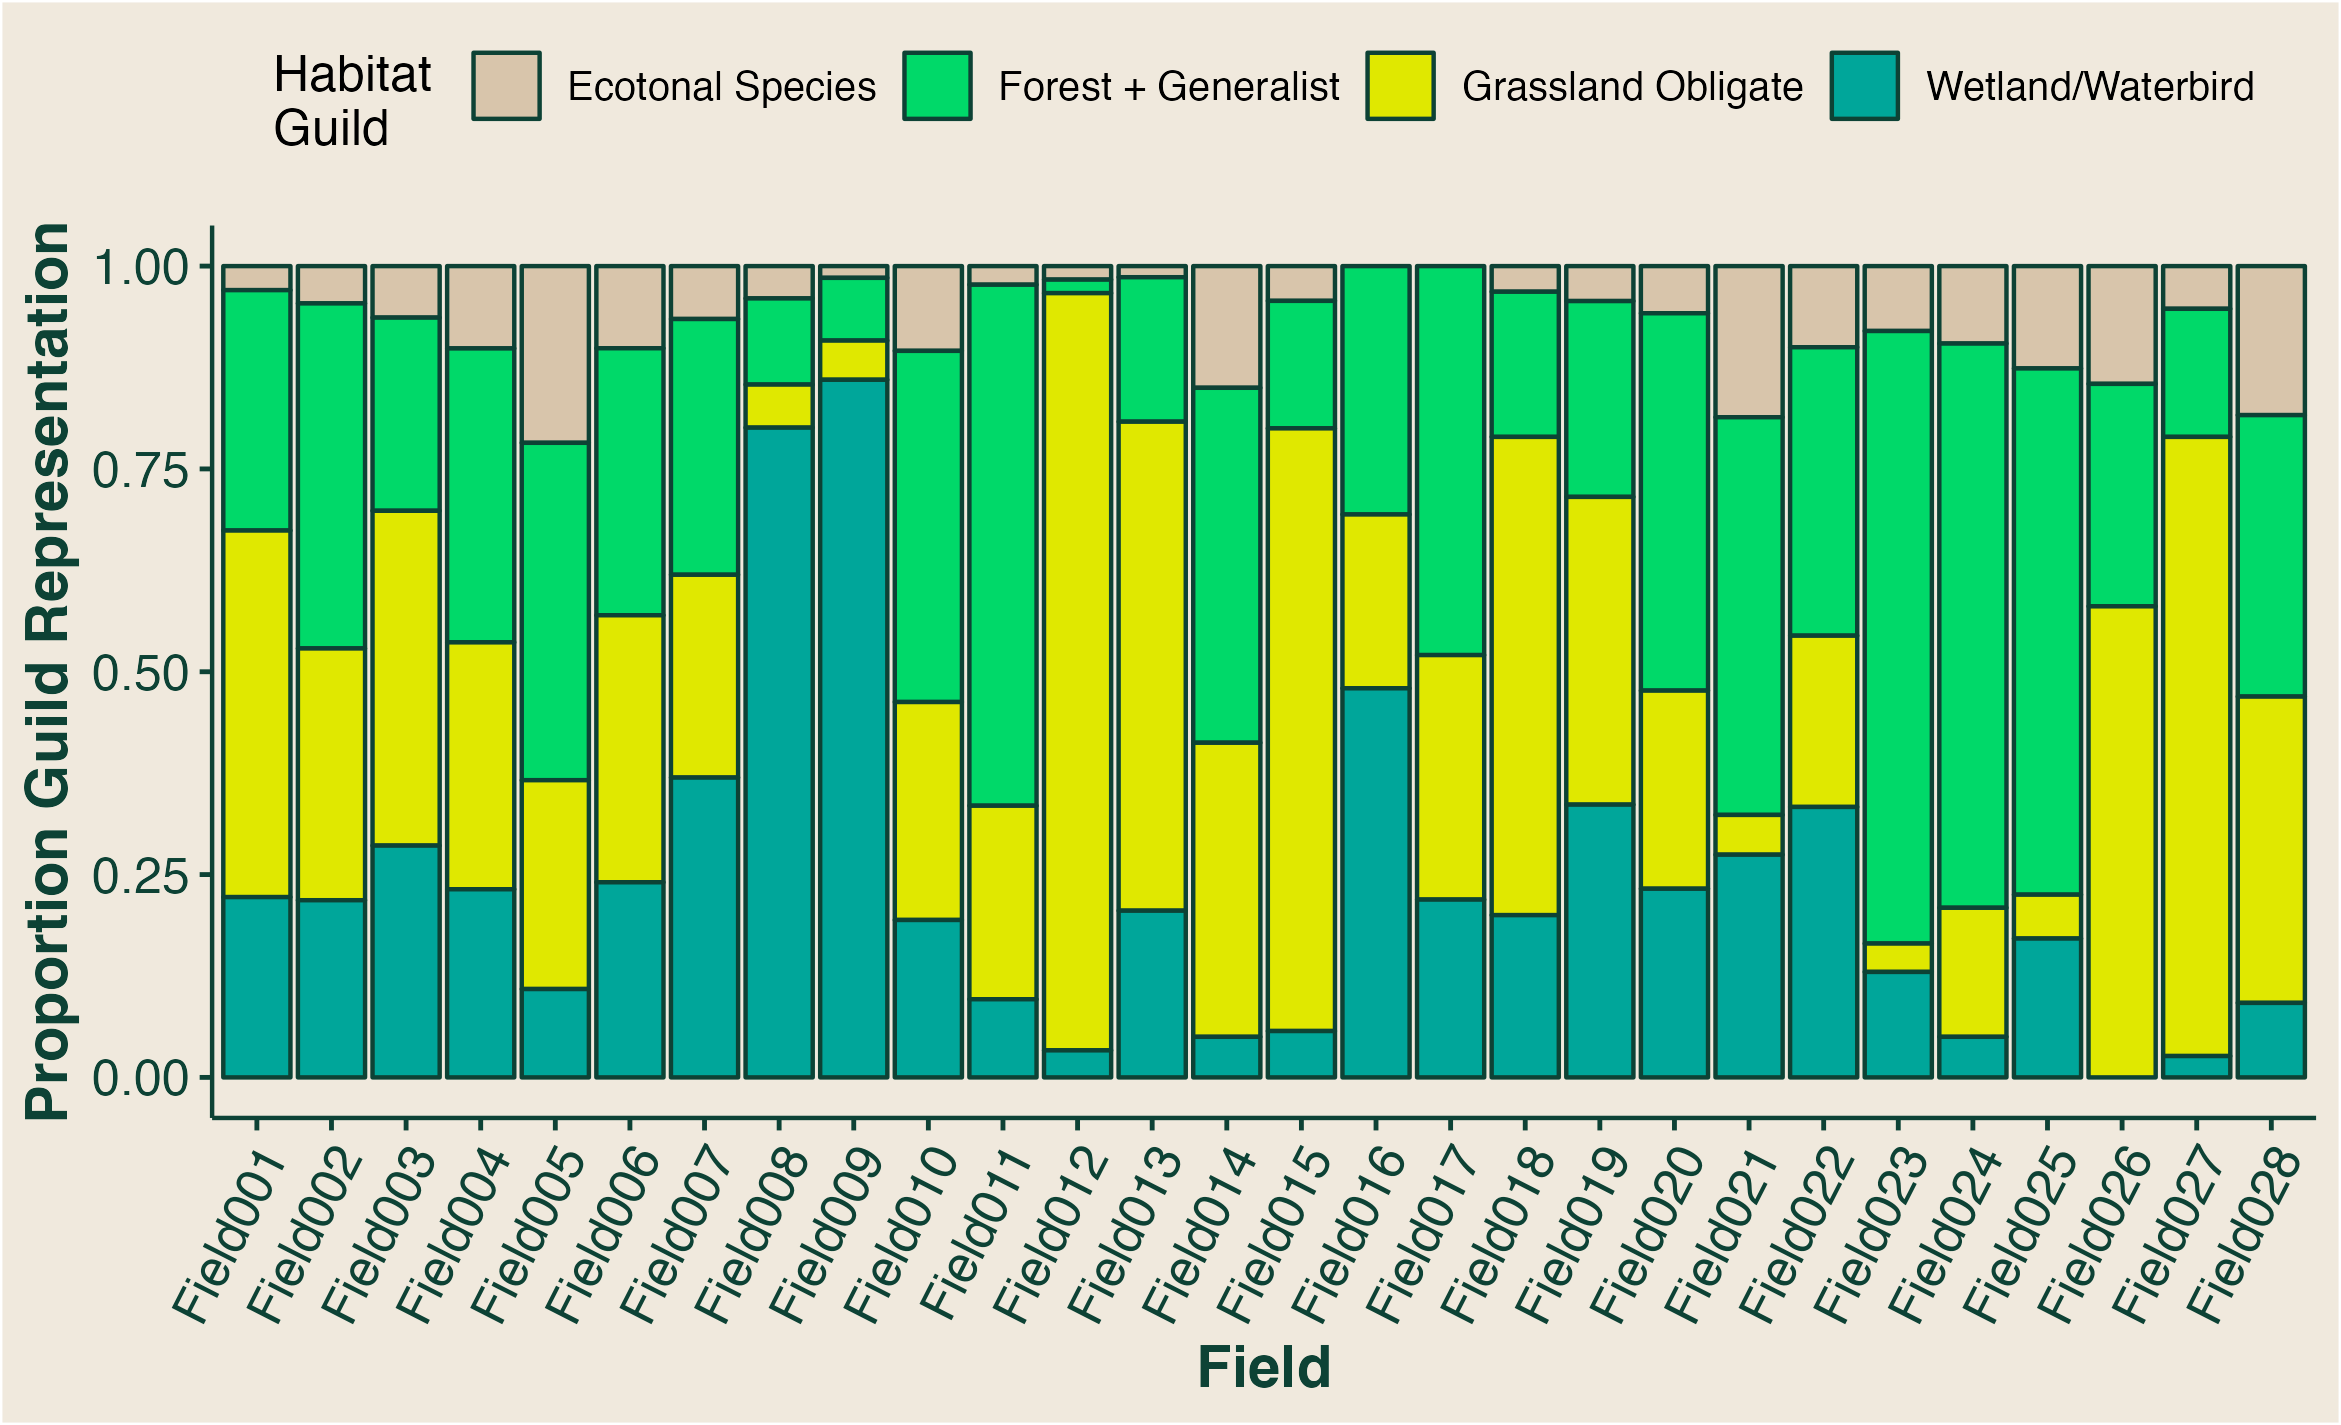
Fig. 3: Proportion of bird species found in each habitat guild by field. Each bar is colored by the proportion of observed species from each habitat guild.
We observed 96 different bird species (appendix i) from four different habitat guilds (a group of species that rely on the same habitat type). In our data, we observed 25 ecotonal species, 45 forest/generalist species, 17 grassland obligate species, and 9 wetland species. The proportion of each of these guilds represented varied by field (Fig. 3). The fewest individuals observed were usually from the ecotonal species habitat guild.
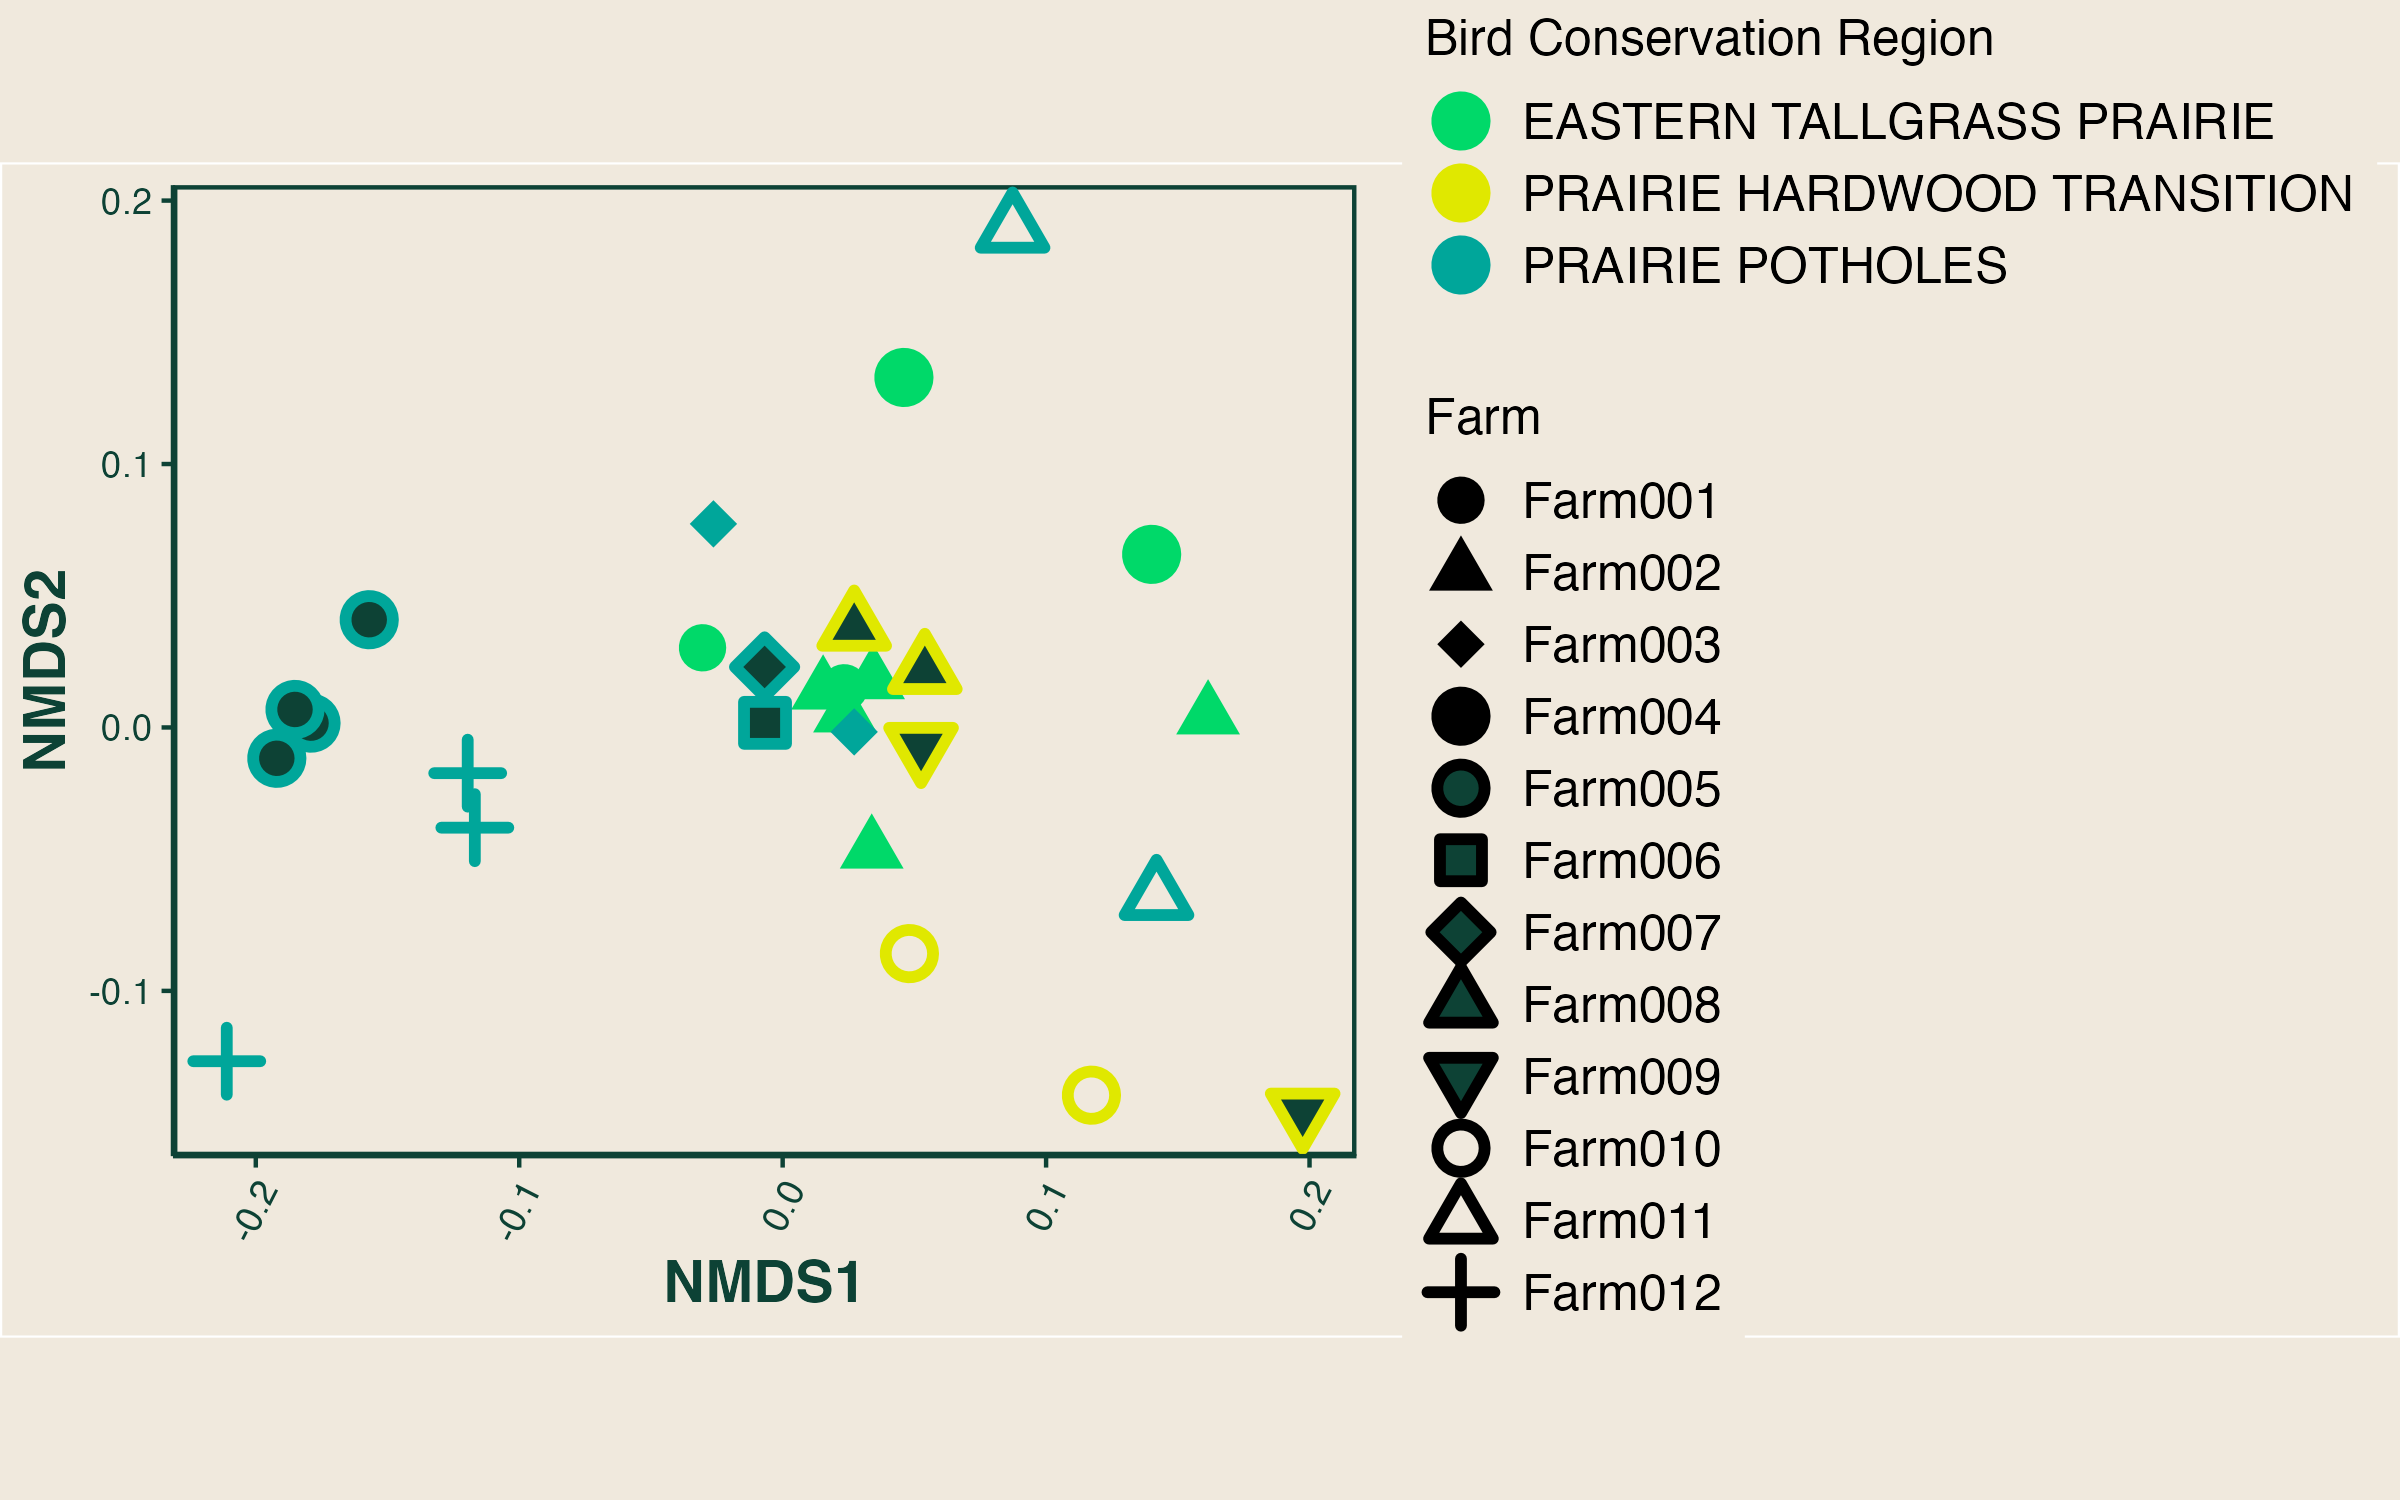
Fig. 4: Bird community similarity based on the presence or absence of a species.Each point is a field. The farm associated with the field is indicated by the point shape and the associated bird conservation region by color. Points that are closer together have more similar bird communities whereas those that are further apart are more dissimilar.
At this point, the community similarity analysis shows which bird communities are the most similar and different from each other (Fig. 4). For example, fields from Farm011 have very different bird communities (e.g., the two points from Farm011 are far away from each other in Fig. 4), whereas fields from Farm004 have similar bird communities (e.g., the points from Farm004 are grouped closely in Fig. 4).
Where are we going from here?
We will continue to monitor breeding bird diversity on the farms in our study to see if there are any changes in species richness (i.e., the number of species), abundances (i.e., the number of individuals per species, and community composition as the land regenerates. We plan to survey breeding bird biodiversity approximately every two years to look for temporal trends in the different fields. Lastly, we hope to help farmers create more habitat space on their land to support a diverse bird community.
Tipping point species
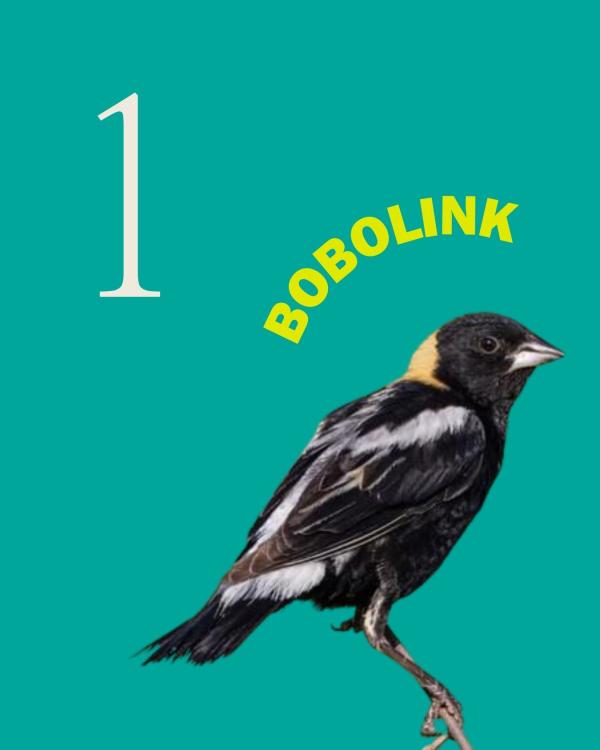
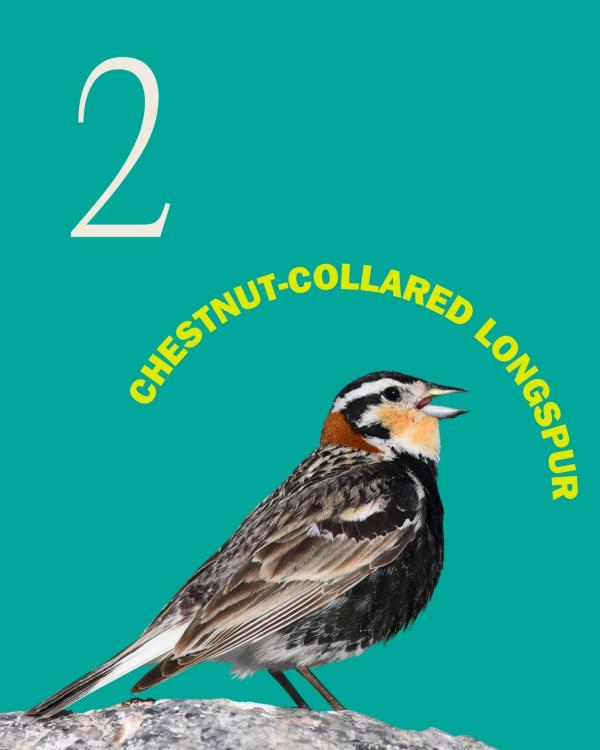
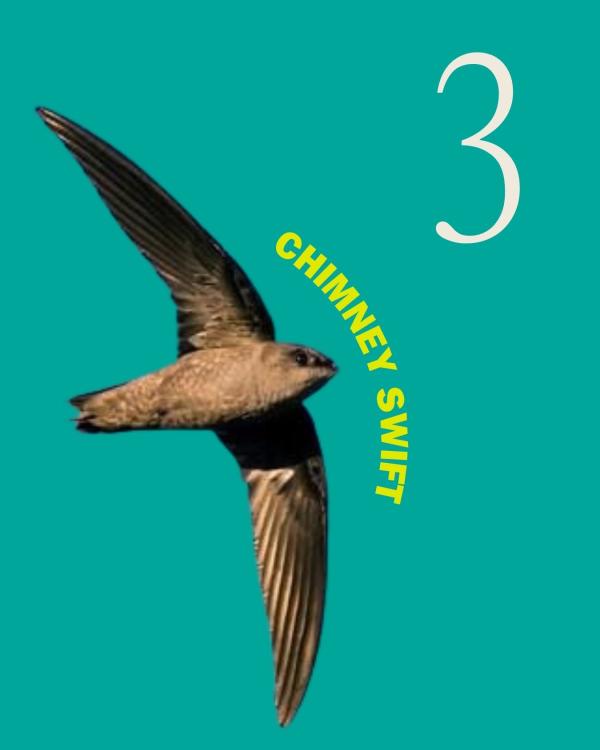
There are 3 ‘tipping point species’ found on our farms: Bobolink, Chestnut-collared Longspur, and Chimney Swift. Tipping point species are those which have lost 50% of their population since 1970 and are on track to lose another 50% of their population in the next 50 years6. These species need conservation efforts to help their populations recover!
What does this data mean?
Currently, we are presenting baseline data for our 28 fields. We plan to work with our partners at RES and other public data repositories to contextualize these findings. For example, we hope to be able to better understand how the species richness and composition found on the 28 research fields compare to other farms and natural areas within the same regions.
Literature Cited